
Key Performance Indicators, or KPIs, are measurements that reflect how effectively your business or organization is working toward its objectives. They can be an excellent way to demonstrate value to your various stakeholders.
When deciding which KPIs to utilize, start by researching common KPIs used in your industry or niche. Identify your organizational goals and your strategy for achieving them, and then determine how you will use the information you learn from KPIs.
What makes a good KPI?
The most useful KPIs have similar criteria to SMART goals – they are specific, measurable, attainable, relevant and timely.
Measurable Goals: KPIs should have a purpose that can be quantified. Even if the underlying outcome isn’t specific, the metrics that measure the initiative should be. For example, a company may wish to increase liquidity. This can’t be directly measured, but you can incorporate liquidity ratios such as the quick ratio into your analysis.
Actionable Goals: KPIs should also be linked to an accomplishment. Calculating a KPI is only half the battle; you must then interpret the result and take action to make and needed adjustments. For example, a goal to have more satisfied customers does not represent an action. Instead, a goal of enhancing customer satisfaction by increasing communication, decreasing response times, and improving product quality is actionable, and all three goals can be measured by KPIs.
Established Timeframe: KPIs should come with a specified timeframe, which aligns with the overall plan. If the goal is to grow your customer base by 30% by the end of the year, your metrics should track progress toward the goal, with a certain percentage to be achieved by a specific date. A 20% growth spurt is great, but if this metric is reported on the last day of the year, there is no time left to improve the metric.
Historical Records: KPI reports should create a historical timeline of successes and trends. Reviewing prior KPI reports is a great way to track how your company has improved over time. You can observe how goals have been achieved, the timeline in achieving those goals, and what initiatives didn’t quite turn out as expected, and incorporate this knowledge into future metrics.
Agile: Businesses must continually adapt to changing market conditions, so KPIs should never be static. While core financial information is reported on a repetitive basis, there should be flexibility with KPI reporting. You can adjust the way the KPI is presented or change what the KPI is tracking without modifying the underlying goal. Follow what is applicable to your business, and be prepared to tweak based on what is going on in the company.
Types of KPIs
There are two main groups of KPIs: results indicators and process indicators. Results indicators measure how well your business is performing financially, whereas process indicators are known as non-financial KPIs and originate from information separate from your accounting statements, such as your customer relationship management system and website. Results and process indicators are not mutually exclusive, as more efficient processes usually produce better results.
Results Indicators: An analysis of results indicators requires up-to-date financial statements, including balance sheet, income, and cash flow statements. Popular results indicators include:
Gross Profit Margin as a Percentage of Sales: Quantifies the amount of money retained versus the amount being paid to suppliers.
Revenue Growth Rate: Measures whether your startup’s growth is plateauing, increasing, or decreasing.
Incremental Sales: Calculates the effectiveness of your marketing campaigns at generating increased sales and revenue.
Process Indicators: Popular process indicators include:
Funnel Drop-Off Rate: Calculates the number of visitors who quit a conversion process, known as a sales funnel, before completion.
Customer Support Tickets: Determines the amount of resolved tickets versus the amount of new tickets and the time in which a resolution is reached.
Percentage of Product Defects: Analyzes the number of defective units divided by the total amount of parts created within the timeframe of examination.
Performance Dashboards
A performance dashboard provides an easy way to visualize your company’s performance using the KPIs you have established while generating consistent improvement feedback. It should help you do three main things:
- Monitor activities and processes using performance metrics and cloud accounting systems to trigger alerts when potential issues appear.
- Identify the source or cause(s) of problems by investigating relevant, timely data from multiple perspectives at varying detail levels.
- Manage processes and people in ways that will maximize performance, optimize decisions, and help you stay on track.
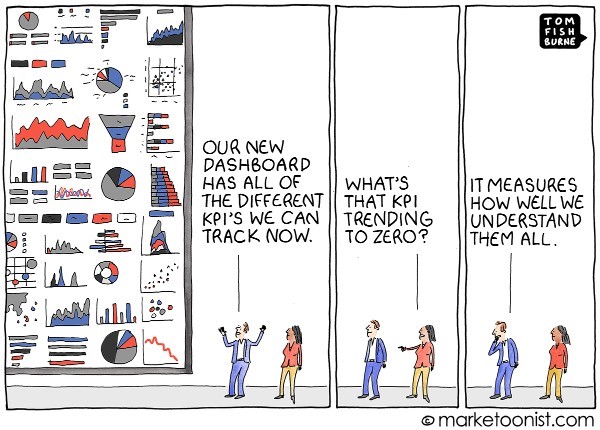
If you identify with this cartoon, we can help. We regularly work with clients to create relevant KPIs and custom performance dashboards. If you would like to learn more, reach out to us.